Temperature
|
 Light
Light
|
 Movement
|
|
|
|
On
some days we re-calibrate our data node and the live streaming
is replaced with a sample.
Streaming
today is ... Off
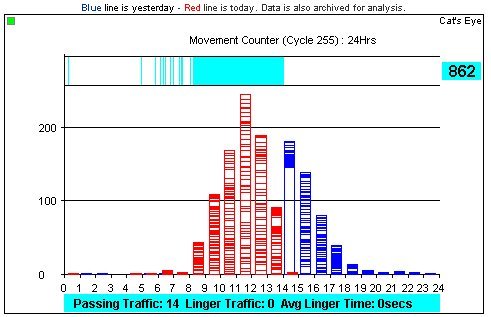
This particular demonstration is presently monitoring time
and motion data. Each histogram bar captures a time interval
(at present an hour, but it could be any length). Within the
histogram bar the events are indicated by a horizontal line.
The plot therefore provides a "density map" of activity
which is stored in a database for later analysis. This technique
could of course be applied to industrial machinery monitoring.
Another key differential measure is the difference between
"passing" and "lingering" movement, for
example in a retail outlet. Other "traffic" analysis
in its widest sense can also be obtained by careful positioning
and calibration of infrared sensors. The addition of web cam
technology offers additional pattern recognition parameters
for more sophisticated monitoring.
|